Research Article | | Peer-Reviewed

Assessment of Morphometric Characteristics and Gully Development Susceptibility in Itu Local Government Area Using Geographic Information System

Received: 17 July 2024     Accepted: 9 August 2024     Published: 27 August 2024
Views:       Downloads:
Abstract

The intensification in urbanization and wrong termination of drains into ravine has resulted in gully development which has rendered people homeless and reduced agricultural and economic development. Consequently, this study assessed morphometric characteristics and gully development susceptibility in Itu Local Government Area using Geographic Information System. In conducting this study, measurement of the morphometric parameters of the identified gullies were carried out while the susceptibility extent of gully development was done using multi-criteria technique in GIS. In assessing the characteristics features of the gullies, Field surveys measurements of gully morphology and hydraulic variables were carried out by the researcher using Global Positioning System (GPS), measuring tape, ranging pole, etc. This help in determining gullied land volume and cross-sectional area. Result of the study shows that the measured gully depth varies from 6.4m at Obong Itam to 25.8m at Enen Atai, while the gully width ranges from 4.1m in Ikot Ekang to 9.3m in Ntiat Itam. The cross-sectional profiles ranges from 45.43m2 to 165.12m2. Also, the cross-sectional profile of the area indicative of V-shape to U- shape, all with very narrow gully width and steeply sloping gully sides, which are features of gullies developed on very loose and incoherent soils that slump/collapse on exposure. On the other hand, the mean sand composition of the soil was 62.2% ranging between 55.3-70.1 while silt ranges from 17.7-25.2 with a mean of 20.2% and clay ranging between 10.0-21.9 with mean of 17.7%. The correlation matrix between the gully depth and cross- sectional area (0.84) and is significant at 99% confidence level, meaning that the retreat of gully sides take place at rates proportional to the rate of gully deepening. In assessing the susceptibility extent of gully development in Itu Local Government Area using multi-criteria Analysis technique, the summary of the map shows that 52.94% of the total study area are highly susceptible to gully development, 28.19% are moderately susceptible while 9.31% and 9.56% marginally and not susceptible respectively to gully development in Itu local government area. The study concludes that the poor soil quality attributes, soil conservation and management practices contribute to gully development in the area, hence, the need for government to enact laws against such activities that favour gully growth and initialization.

Published in Journal of Energy and Natural Resources (Volume 13, Issue 3)
DOI 10.11648/j.jenr.20241303.12
Page(s) 125-137
Creative Commons

This is an Open Access article, distributed under the terms of the Creative Commons Attribution 4.0 International License (http://creativecommons.org/licenses/by/4.0/), which permits unrestricted use, distribution and reproduction in any medium or format, provided the original work is properly cited.

Copyright

Copyright © The Author(s), 2024. Published by Science Publishing Group

Keywords

Morphometry, GIS, Gully, Susceptibility

1. Introduction
The impending catastrophic tendency from gully development cannot be over-emphasized especially in agro-environment of tropical Africa and Nigeria in particular. Gullies are a problem in the humid tropics and their occurrence has caused severe loss of soils, particularly for agricultural productivity in many parts of Nigeria and resulted in economic, human and social losses in many of the cities . When formed, gullies could be sufficiently large enough to disrupt farming operations and too large to be filled during normal cultivation . In Sub-Saharan Africa, gully development has taken turn lately in many countries with serious geomorphic instability and disequilibrium . The intensification in urbanization and wrong termination of drains into ravine has resulted in gully development in the ravine area. The rapidity in gully expansion processes has attracted the attention of the Ministry of Environment to setup erosion control units with different names in many states in Nigeria .
All over the world, gully erosion constitutes the major ecological problem and requires adequate scientific and proper technical competence in the prevention and control of this menace. Gully erosion impacts on biophysical environment negatively to the detriment of community’s socio-economic activities . Many gullies are initiated from poorly constructed side drains and termination of culvert at unsafe points. With successive rains, the gullies originate as narrow rills with a down-slope orientation, which undergo progressive widening and deepening . However, gully erosion is a recurrent geomorphic scenario with ecological instability on landscape that requires attention by various stakeholders ranging from hunters, foresters, road construction engineers, sand miners, farmers and other earth scientist. Gully erosion and various strategies for amelioration have not considered the involvement of stakeholders holistically. The constraint experienced by land users has considered collaborative involvement of stakeholders to reduce negative impact on land for sustained productivity.
Gully erosion has seriously affected agricultural productivity, farmland, buildings and settlement. This has rendered people homeless and reduced agricultural and economic development. This reflects the severity of the problem associated with erosion lately . In Itu, and some parts of Akwa Ibom State, the poorly terminated drain generated a waterfall effect on the coastal plain sand soil type which resulted in the gully erosion. However, a good knowledge of surface hydrology would have prevented this scenario by determining the effective runoff and properly designing an effective drain that can accommodate the volume and velocity of runoff generated in the state. Today, many farmers within Itu LGA have move away from erosion sites in search for productive lands to cultivate. Coupled with the scarcity of cultivable land, it has resulted in a serious competition for land and thus threatened agricultural intensification and development. Consequently, the concern for deteriorating agro-environment is indicated by numerous appeals by agro-communities to government for aid in combating erosion menace. In Itu, Ikot Obong Edong, Akon Itam, Mbiabam Itam, Ikot Andem, Ikot Ekang, Ntiat Itam, Ikot Essien, Ekim Itam, Mbak Itam, Ikot Ayan, Enen Atai, Obong Itam, and many others are ravaged by gully menace.
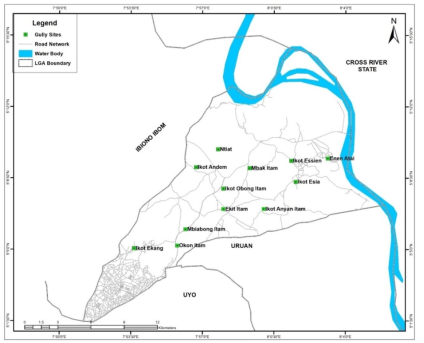
Figure 1. Map of Itu LGA Showing Gully Impacted Sites.
1.1. Aim of the Study
The aim of this study is to assess gully erosion features and its susceptibility extent of development in Itu Local Government Area.
1.2. Study Area
Itu is bounded in the North and North-East by Odukpani in Cross River State and Arochukwu in Abia State, in the West by Ibiono Ibom and Ikono Local Government Areas, in the South and South-East by Uyo and Uruan Local Government Areas, respectively.
In the research design, measurement of the characteristics of the identified gullies (width, depth, cross-sectional area, etc.) were carried out. In assessing the susceptibility extent (slope, relief, vegetation) of gully development in Itu Local Government Area, multi-criteria approach was adopted with data sourced from Digital Elevation Model (DEM) and Landsat 8+ Imagery from USGS.
2. Result
2.1. Characteristic Features of Gully Sites in Itu Local Government Area
In assessing the morphometric parameters of the gullies, Field surveys measurements of gully morphology and hydraulic variables were carried out by the researcher using Global Positioning System (GPS), measuring tape, ranging pole, etc. This help in determining gullied land volume and cross-sectional area. In all, twelve (12) gully sites were identified and the result is presented in Table 1.
Table 1. Morphometry of the studied gullies based on sites.

S/N

Community / Gully Site

Morphometry of the gullies

Soil texture Composition (%)

gully length (m)

gully width (m)

gully depth (m)

length/width ratio

length/depth ratio

cross-sectional area (m3)

Sand

Silt

Clay

1

Ikot Ayan Itam

115.6

7.7

8.5

15.01

13.60

65.45

64.5

24.2

11.3

2

Ikot Andem

187.8

5.6

10.1

33.54

18.59

56.56

56.1

25.2

18.7

3

Ikot Ekang

142.7

4.1

13.8

34.80

10.34

56.58

68.2

10.3

21.5

4

Ntiat Itam

133.5

9.3

9.3

14.35

14.35

86.49

61.4

20.3

18.3

5

Ikot Essien

201.6

7.4

17.3

27.24

11.65

128.02

58.9

19.2

21.9

6

Ekim Itam

184.2

6.3

15.2

29.24

12.12

95.76

55.3

23.1

21.6

7

Mbak Itam

179.6

8.8

11.1

20.41

16.18

97.68

67.3

18.7

14.0

8

Mbiabam

182.3

4.3

14.9

42.40

12.23

64.07

59.8

25.2

15.0

9

Enen Atai

194.3

6.4

25.8

30.36

7.53

165.12

66.2

18.3

15.5

10

Akon Itam

209.4

5.9

7.7

35.49

27.19

45.43

57.8

19.7

22.5

11

Obong Itam

174.5

8.3

6.4

21.02

27.27

53.12

60.6

17.7

21.7

12

Ikot Esia

218.5

7.3

12.2

29.93

17.91

89.06

70.1

19.9

10.0

Mean

177.0

6.8

12.7

27.8

15.7

83.6

62.2

20.2

17.7

Average

115.6-218.5

4.1-9.3

6.4-25.8

14.34-42.4

7.53-27.27

45.43-165.12

55.3-70.1

17.7-25.2

10.0-21.9

Source: Field Survey (2023)
Table 1 indicates the morphometric characteristics of the gullies in Itu local government area of Akwa Ibom State. According to the results, measured gully depth varies from 6.4m at Obong Itam to 25.8m at Enen Atai, while the gully width ranges from 4.1m in Ikot Ekang to 9.3m in Ntiat Itam. The cross-sectional profiles ranges from 45.43m2 to 165.12m2. More so, the cross-sectional profile of the area are indicative of V-shape to U- shape, all with very narrow gully width and steeply sloping gully sides, which are features of gullies developed on very loose and incoherent soils that slump/collapse on exposure. On the other hand, the mean sand composition of the soil was 62.2% ranging between 55.3-70.1 while silt ranges from 17.7-25.2 with a mean of 20.2% and clay ranging between 10.0-21.9 with mean of 17.7%. This soil characteristics depict an area of dominant sandy soil that is highly prone to gully development . Thus, the susceptibility of the soil to gully development is not unconnected to the nature of the soil physical properties in Itu local government area.
Source: Field Survey (2023)

Download: Download full-size image

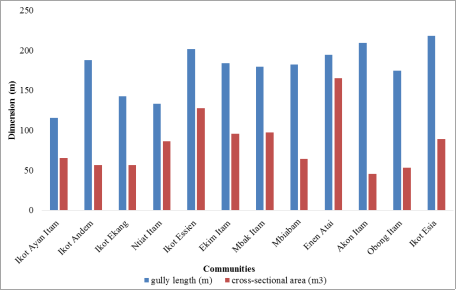
Figure 2. Chart Showing Gully-Length and Cross-Sectional Areas.
Figure 2 further explain the dimension of gullies across the study area. With the gully length ranging between 115.6-218.5m and the cross-sectional area ranging between 45.43-165.12m2, Ikot Esia recorded the highest length of gully (218.5m) followed by Akon Itam and Ikot Essien with 209.4m and 201.6m respectively. The shortage gully length was captured in Ikot Ayan (115.6m), Ntiat Itam (133.5m) and Ikot Ekang (142.7m) respectively. On the other hand, the highest cross-sectional area of the gully was captured in Enen Atai (165.12m2), followed by Ikot Essien (128.02m2), Mbak Itam (97.68m2) and Ekit Itam (95.76m2) respectively. Figure 3 shows the measurement of gully dimension across the study area.
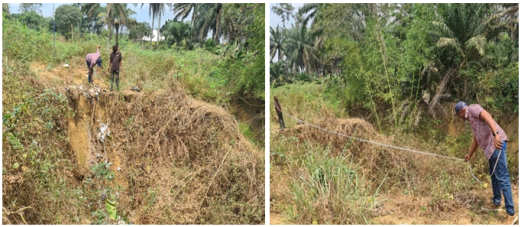
Figure 3. Field Measurement in Itu Gully Site.
Relationship Between Gully Depth and Cross -Sectional Area of Gully Profiles.
Source: Field Survey (2023)

Download: Download full-size image

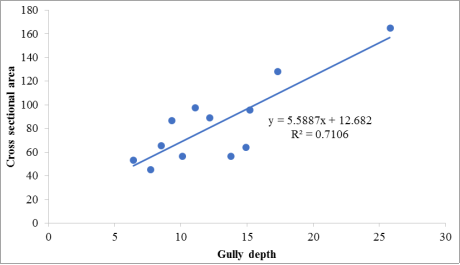
Figure 4. Relationship between gully depth and Cross -sectional area of gully profiles.
Sequel to the already established strong positive relationships between the gully depth and cross-sectional area, a regression model was employed to validate the strength of the relationships (Figure 4). The regression model, Y= 5.5887x + 12.682 (where y and x are gully cross sectional area and gully depths respectively) indicates that gully depth alone accounts for 71% of variance in gully cross-sectional area in the study area (Figure 4).
2.2. Research Hypothesis
Ho1: There is no significant correlation among morphometry parameters of gullies in Itu local government area.
Table 2. Correlation Matrix of morphometry parameters of gullies in the Study Area.

Correlations

gully_length

gully_width

gully_depth

length_width_ratio

length_depth_ratio

cross_sectional_area

gully_length

1

-0.177

0.296

0.557

0.260

0.266

gully_width

1

-0.309

-.897**

0.232

0.239

gully_depth

1

0.347

-.760**

.843**

length_width_ratio

1

-0.067

-0.125

length_depth_ratio

1

-.624*

cross_sectional_area

1

**. Correlation is significant at the 0.01 level (2-tailed).
*. Correlation is significant at the 0.05 level (2-tailed).
Source: Analysis Using SPSS (Version 25.0)
The correlation matrix (Table 2) between the gully depth and cross- sectional area (0.84) and is significant at 99% confidence level. This result simply implies that the retreat of gully sides take place at rates proportional to the rate of gully deepening (as deep gullies channels enhance the process of translational landslides on exposed gully sides). This explains why cross-sectional area also correlates strongly with gully depth (0.84). The result also indicates a significant correlation between gully with and length/width ratio (-0.897), gully depth and length/depth ratio (-0.760) as well as length/depth ratio with cross sectional area (-0.624). This implies an inverse correlation between gully width and length/width ratio, among others.
2.3. Assessing the Susceptibility Extent of Gully Development in Itu Local Government Area
Five conditioning factors were selected representing mainly the primary local terrain conditions as shown in Table 3. These include: slope, soil texture, elevation and land use. Since the computation of gully susceptibility map is raster-based, all vector conditioning factors (e.g., land use) were converted to raster with pixel size of 30-30m. Moreover, the classes of conditioning factors were standardized to a uniform rating scale from 1 to 4 which reflects the following susceptibility to gully initiation: highly vulnerable zone (1), moderately vulnerable zone (2), marginally vulnerable zone (3) non-vulnerable zone (4). Elevation factor affects gully initiation in the way that higher elevations are generally less susceptible to gully development. Elevation map was designed using the digital elevation model (DEM) of the study area, extracted from USGS. From the DEM, contour lines and elevation points were extracted and the interpolation method for creating hydrologically correct DEMs was used to show places of equal elevation. In the slope map, steeper slopes are more susceptible to landslide occurrence. The slope angle map was created based on the DEM using the ArcGIS tools. Moreover, the slopes were reclassified into four classes based on recent studies by . Slope aspect is also an important parameter for gully susceptibility mapping. Similarly, land-use characteristics and soil texture are another factor that triggers gully development (Table 3). Table 3.1 is adopted from the work of.
The land-use map and its reclassification map are shown in Figures 5 and 6. The soil texture is represented in Figures 7 and 8. Elevation map and the reclassification is shown in Figures 9 and 10 while the slope map is shown in Figures 11 and 12. The classified maps were integrated to produce the gully susceptibility map as represented in Figure 13.
Table 3. Classes of Gully conditioning factors, ratings and weight.

Factor

Class

Rating

Weight

Slope (degree)

<1.25

1

0.2

1.25-2.71

2

2.71-4.79

3

>4.80

4

Soil Texture

Loam

4

0.3

Clay loam

3

Clay

2

Sand

1

Elevation (m)

0-30

1

0.3

31-60

2

61-90

3

>90

4

Land use

Built-Up

1

0.2

Farmland

2

Light Forest

3

Thick Forest

4

Water body

4

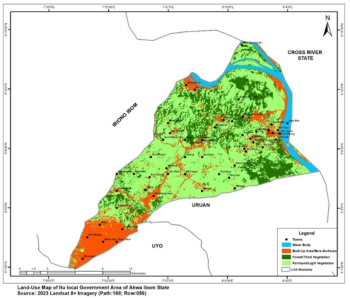
Figure 5. Land-Use Map of Itu.
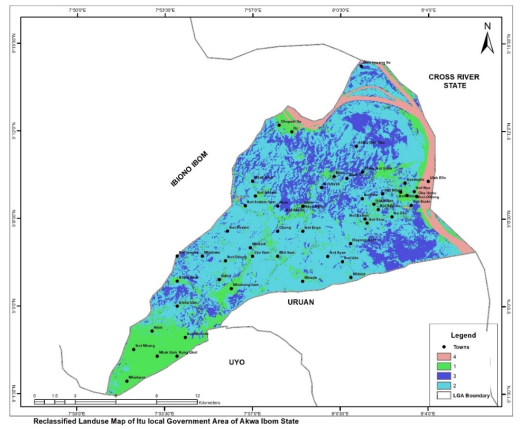
Figure 6. Reclassified Land-Use Map of Itu.
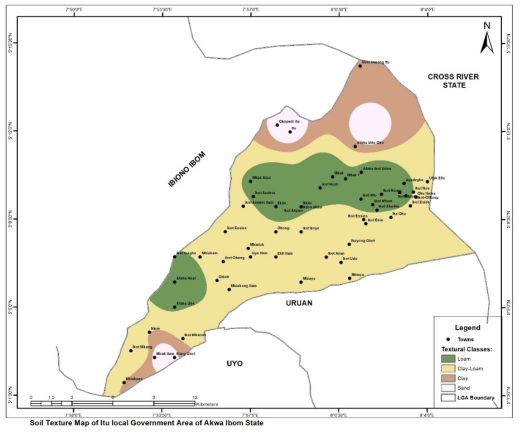
Figure 7. Soil Texture Map of Itu.
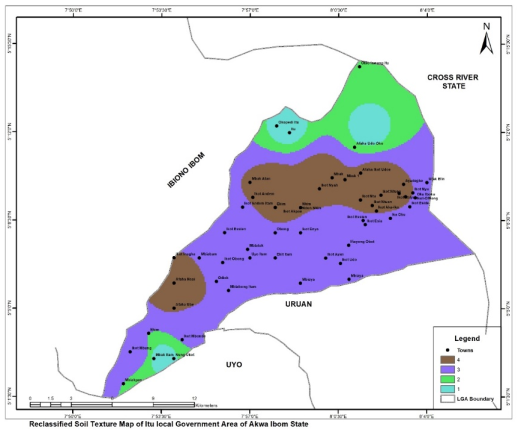
Figure 8. Reclassified Soil Texture Map of Itu.
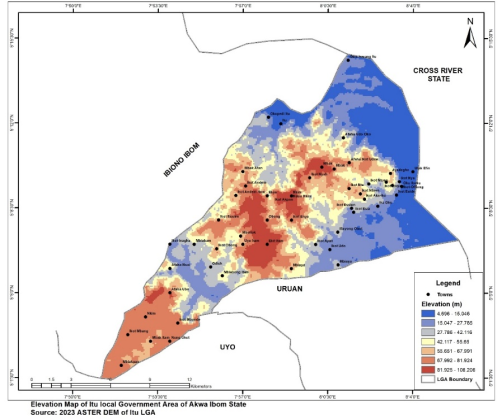
Figure 9. Elevation Map of Itu.
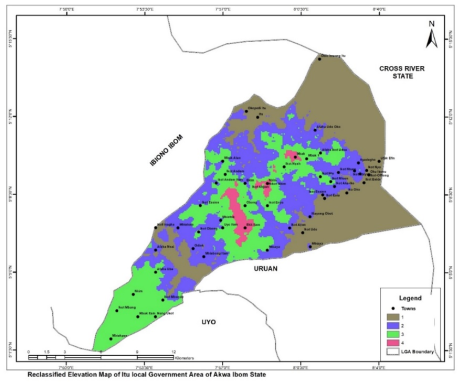
Figure 10. Reclassified Elevation Map of Itu.
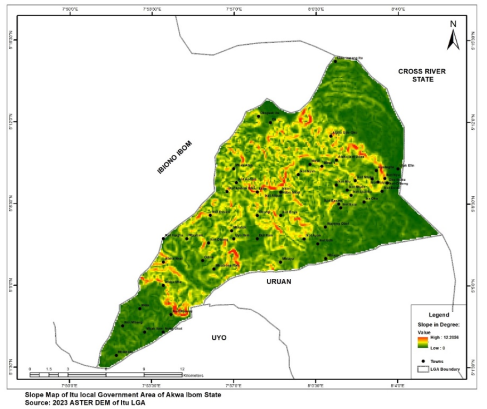
Figure 11. Slope Map of Itu.
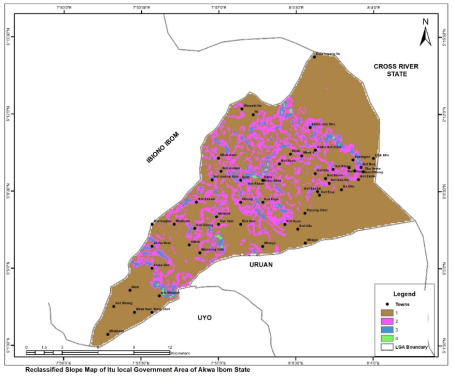
Figure 12. Reclassified Slope Map of Itu.
2.4. Relative Weight of the Parameters
The ranking is related to their relative importance as listed in Table 4. The relative importance has a range from 1 to 4; 1 means an equal contribution of the pairwise parameter and 4 means a very important parameter . The codes used in the maps are shown in Table 4.
Table 4. Code and Classes of Vulnerability.

Code

Class

Description

1

Highly vulnerable zone

Zones that are extremely susceptible to gully occurrence

2

Moderately vulnerable zone

Zones that are fairly susceptible to gully occurrence

3

Marginally vulnerable zone

Zones that are prone to gully occurrence

4

Non-vulnerable zone

Zones that are not susceptible to gully occurrence

2.5. Multi-Criteria Analysis (MCA) - Analytical Hierarchy Process (AHP)
The first step was to define the relative importance for the chosen conditioning factors for which the empirical knowledge and findings of recent studies were used. The relative importance of the selected factors ranges from 4 (highest importance) to 1 (lowest importance). In the AHP technique, the weights for each factor were determined by using the principal eigenvector of a 4 by 4 square reciprocal matrix of pairwise comparison between the factors, which reflects the relative significance of one factor compared to the others . The result produces the final gully susceptibility map of Itu (Figure 13).
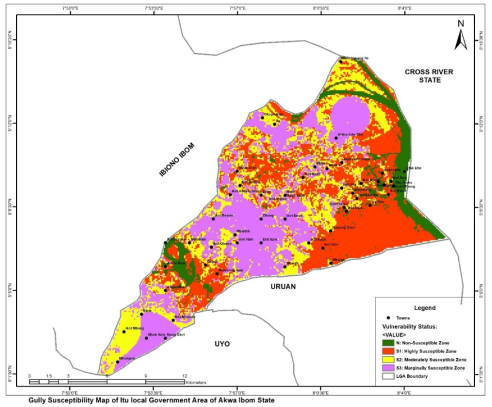
Figure 13. Gully Susceptibility Map of Itu Local Government Area.
Table 5. Summary of Gully Vulnerability Status of Itu Local Government Area.

Status

Percentage

Highly vulnerable

52.94

Moderately vulnerable

28.19

Marginally vulnerable

9.31

Not vulnerable

9.56

TOTAL

100

The summary of the map shows that 52.94% of the total study area are highly susceptible to gully development, 28.19% are moderately susceptible while 9.31% and 9.56% marginally and not susceptible respectively to gully development in Itu local government area (Table 5).
3. Discussion
The result of the morphometric characteristics of the gullies in Itu shows that gully depth varies from 6.4m at Obong Itam to 25.8m at Enen Atai, while the gully width ranges from 4.1m in Ikot Ekang to 9.3m in Ntiat Itam. Similarly, the cross-sectional profiles ranges from 45.43m2 to 165.12m2. More so, the cross-sectional profile of the area is indicative of V-shape to U- shape, all with very narrow gully width and steeply sloping gully sides, which are features of gullies developed on very loose and incoherent soils that slump/collapse on exposure. On the other hand, the mean sand composition of the soil was 62.2% ranging between 55.3-70.1 while silt ranges from 17.7-25.2 with a mean of 20.2% and clay ranging between 10.0-21.9 with mean of 17.7%. Also, the soil characteristics depict an area of dominant sandy soil that is highly prone to gully development. This finding corresponds with the work of that soil with high sand composition is highly vulnerable to gully development. The result corresponds with the work of which concluded that unsustainable development is a complementary agent of erosion in the built-up area, in addition to the soil characteristics. Thus, attributing to the aggravation of gully process in built – up environments.
In examining the susceptibility of Itu Local Government Area to gully development, the multi-criteria technique adopted revealed that 52.94% of the total study area are highly susceptible to gully development, 28.19% are moderately susceptible while 9.31% and 9.56% marginally and not susceptible respectively to gully development in Itu local government area. The result corresponds with the work of which demonstrated the management of spatial distribution of gully erosion over time using remote sensing images, aerial photographs and GIS technology at relatively large spatial and temporal scales and dynamic monitoring of large scale (large area, long-term) and small-scale (small area, short term) gullies using multi-source, multi-scale remote sensing monitoring systems combined with ground measurements and high-resolution satellite, low-altitude UAV remote sensing. Thus, ratifying the role of GIS technology in effective management and control of gully initiation and expansion.
In all the affected communities, they have poor gully control structures as existing gully management strategies. Consequently, significant proportion of the overland flow therefore flows along the roads and the unpaved drains while some of the provided drains are not big enough to contain storm water while some are blocked by debris thus could not accommodate the volume of surface runoff generated during heavy rainstorms. This resulted in gully expansion and landslide especially at the peak of rainy season. In some places, improved wooden bridges were constructed over some of the gullies to link some of the streets and allow pedestrians to pass. But these measures do not stand the taste of time and require government intervention. The result relates with the work of that reported gully control measures which includes the use of various drop structures, soil check dams, masonry check dams, gabion check dams, wicker check dams, continuous live wicker, a shrub plant enclosure, and an arbor plant enclosure. It also matches with the work of who suggested measures to be employed in gully control in Nigeria which are; improved farming practices, prohibition of dumping of refuse on the river channels and floodplains, employing the cultural method and the role of the government in enacting laws against location of engineering structures on waterways amongst many.
4. Conclusion
Gully erosion is a very serious problem worldwide. In Itu local government area, gully erosion control is very essential for the protection of human lives, to maintain the crop productivity of the soil as well as to control sedimentation and pollution in streams and rivers. The absence of systematic and periodic review of operations and practices relating to environmental protection is responsible for the continuous degradation of our ecosystem, leading to the formation/ expansion of gullies in Itu. The study shows that basic method used to check the development of gully is the use of sand bags and grade have which is not being very effective in controlling this menace. Moreso, the absence of major stakeholder involvement in gully management is alarming and need urgent attention.
5. Recommendation
Fact from this study revealed that gully erosion in Itu is a continuous natural phenomenon/ hazard which cannot be stopped completely but can be managed and minimized. Based on the result of the study, the following recommended that considering the poor soil quality attributes, soil conservation and management practices must place premium on improving the soil organic matter content with its potential to improving soil structural stability, and thus reduce soil erosion and gullying in the area. More so, since the causes of gully erosion include both natural and anthropogenic sources, and bearing it in mind that we have little or no control over the natural causes of gully erosion, stakeholders (local, state, and federal ministries of environment, agriculture, etc.) should discourage all practices that are capable of initiating gully erosion, thus, the need for government to enact laws against such activities that favour gully growth and initialization.
Abbreviations

GIS

Geographic Information System

GPS

Global Positioning System

MCA

Multi-Criteria Analysis

AHP

Analytical Hierarchy Process

DEM

Digital Elevation Model

USGS

United State Geological Survey

SPSS

Statistical Packages for Social Sciences

Author Contributions
Ehiremen Lucky: Conceptualization, Data curation, Funding acquisition, Investigation, Methodology, Writing – original draft
Abraham Comfort: Conceptualization, Data curation, Funding acquisition, Investigation, Methodology, Writing – original draft
Saturday Unyime: Formal Analysis, Methodology, Software, Visualization, Writing – review & editing
Conflicts of Interest
The authors declare no conflicts of interest.
References
[1] Abdulfatai I., Okunlola I., Akande W., Momoh L. and Ibrahim K. (2014) Review of Gully Erosion in Nigeria: Causes, Impacts and Possible Solutions. Journal of Geosciences and Geomatics, 2(3) 125-129.
[2] Abraham C., Rogers, W. and John D. (2018) Evaluation of Community Efforts in Gully Management in Ikot Obong Edong, Itu, Akwa Ibom State; Gender Perspective. International Journal of Social Science. 12(2) April-June.
[3] Adegboyega, O. (2019) The Impact of Soil Erosion on Agricultural Land and Productivity in Efon Alaaye, Ekiti State, Nigeria. Journals of Tropical Agriculture 4(1) 42-49.
[4] Aditya, S. (2016). Role of Women in Environmental Conservation. International Journal of Political Science and Development 4(4) Pp. 140-145.
[5] Bera A, Mukhopadhyay BP, Das D. (2019) Landslide hazard zonation mapping using multicriteria analysis with the help of GIS techniques: a case study from Eastern Himalayas, Namchi, South Sikkim. Nat Hazards. 96(2): 935–959.
[6] Akanwa, C. (2017) studied Changing Climate and the Effect of Gully Erosion on Akpo Community Farmers in Anambra State, Nigeria. International Journals of Soil Sciences 3(1) 67-72.
[7] Comfort A., Unyime S., Akan T. and Isaac I. (2019) Soil Physical Properties: A Determinant of Soils Susceptibility to Gully Erosion Menace in Uyo Metropolis, Akwa Ibom State, Nigeria. International Journal of Social Sciences 12(3) 125-137.
[8] Feng, L., and Li, B. B. (2018). Establishment of high precision terrain model of eroded gully with UAV oblique aerial photos and ground control points. Trans. Chin. Soc. Agric. Eng. 34, 88–95.
[9] Frankl, A.; Deckers, J.; Moulaert, L.; Van Damme, A.; Haile, M.; Poesen, J.; Nyssen, J. (2014) Integrated Solutions for Combating Gully Erosion in Areas Prone to Soil Piping: Innovations from the Drylands of Northern Ethiopia. Land Degradation and Development; 2014.
[10] Ibitoye, M., Ekanade, O., Jeje, L., O. and Eludoyin, A. (2021) Characterisation of gully formed in built up area in southwestern Nigeria. African Journal of Geography and Regional Planning 8(4), 001-008.
[11] Nigerian Erosion and Watershed Management Project (NEWMAP) (2017) Akwa Ibom State Project Management Unit Resettlement Action Plan (RAP) for Etim Umana Gully Erosion Site in Uyo L. G. A. of Akwa Ibom State Final Report.
[12] Oparaku, A. and Iwar, E. (2016) studied Relative Vulnerability to Gully Erosion of Three Geological Sediments: A Texture-Based Assessment. Journals of Environmental Management. 5(2) 121-142.
[13] Poessen, J., Verstaetan, J. and Valentine, S. (2020). Gully erosion and environmental Change: importance and Research needs catena 50(2-4) pp 91-133 Reviews in Engineering Geology, Geological Society of America.
[14] Pu, L. M., Zhang, S. W., Wang, R. H., Chang, L. P., and Yang, J. C. (2016). Analysis of erosion gully information extraction based on multi-resource remote sensing images. Geogr. Geo-Inf. Sci. 32, 90–94.
[15] Rysin, I., Grigoriev, I., Zaytseva, M., Golosov, V., and Sharifullin, A. (2017). Longterm monitoring of gully erosion in Udmurt republic, russia. Proc. IAHS. 375, 1–4.
[16] Saaty T. (1980). The Analytic Hierarchy Process. New York (NY): Mc Graw Hill Company.
[17] Udosen, C. (2019) ‘’Gully erosion and cities: An unwanted partnership’’. A paper presented at the Faculty of Social Sciences Seminar on February, CBN Hall, University of Uyo.
[18] Xiaobing L, Hao L, Shengmin Z, Richard M. C and Xing Z (2019) “Gully Erosion Control Practices in Northeast China: A Review”. Sustainability, 11(18).
Cite This Article
  • APA Style

    Lucky, E., Comfort, A., Unyime, S. (2024). Assessment of Morphometric Characteristics and Gully Development Susceptibility in Itu Local Government Area Using Geographic Information System. Journal of Energy and Natural Resources, 13(3), 125-137. https://doi.org/10.11648/j.jenr.20241303.12

    Copy | Download

    ACS Style

    Lucky, E.; Comfort, A.; Unyime, S. Assessment of Morphometric Characteristics and Gully Development Susceptibility in Itu Local Government Area Using Geographic Information System. J. Energy Nat. Resour. 2024, 13(3), 125-137. doi: 10.11648/j.jenr.20241303.12

    Copy | Download

    AMA Style

    Lucky E, Comfort A, Unyime S. Assessment of Morphometric Characteristics and Gully Development Susceptibility in Itu Local Government Area Using Geographic Information System. J Energy Nat Resour. 2024;13(3):125-137. doi: 10.11648/j.jenr.20241303.12

    Copy | Download

  • @article{10.11648/j.jenr.20241303.12,
      author = {Ehiremen Lucky and Abraham Comfort and Saturday Unyime},
      title = {Assessment of Morphometric Characteristics and Gully Development Susceptibility in Itu Local Government Area Using Geographic Information System
    },
      journal = {Journal of Energy and Natural Resources},
      volume = {13},
      number = {3},
      pages = {125-137},
      doi = {10.11648/j.jenr.20241303.12},
      url = {https://doi.org/10.11648/j.jenr.20241303.12},
      eprint = {https://article.sciencepublishinggroup.com/pdf/10.11648.j.jenr.20241303.12},
      abstract = {The intensification in urbanization and wrong termination of drains into ravine has resulted in gully development which has rendered people homeless and reduced agricultural and economic development. Consequently, this study assessed morphometric characteristics and gully development susceptibility in Itu Local Government Area using Geographic Information System. In conducting this study, measurement of the morphometric parameters of the identified gullies were carried out while the susceptibility extent of gully development was done using multi-criteria technique in GIS. In assessing the characteristics features of the gullies, Field surveys measurements of gully morphology and hydraulic variables were carried out by the researcher using Global Positioning System (GPS), measuring tape, ranging pole, etc. This help in determining gullied land volume and cross-sectional area. Result of the study shows that the measured gully depth varies from 6.4m at Obong Itam to 25.8m at Enen Atai, while the gully width ranges from 4.1m in Ikot Ekang to 9.3m in Ntiat Itam. The cross-sectional profiles ranges from 45.43m2 to 165.12m2. Also, the cross-sectional profile of the area indicative of V-shape to U- shape, all with very narrow gully width and steeply sloping gully sides, which are features of gullies developed on very loose and incoherent soils that slump/collapse on exposure. On the other hand, the mean sand composition of the soil was 62.2% ranging between 55.3-70.1 while silt ranges from 17.7-25.2 with a mean of 20.2% and clay ranging between 10.0-21.9 with mean of 17.7%. The correlation matrix between the gully depth and cross- sectional area (0.84) and is significant at 99% confidence level, meaning that the retreat of gully sides take place at rates proportional to the rate of gully deepening. In assessing the susceptibility extent of gully development in Itu Local Government Area using multi-criteria Analysis technique, the summary of the map shows that 52.94% of the total study area are highly susceptible to gully development, 28.19% are moderately susceptible while 9.31% and 9.56% marginally and not susceptible respectively to gully development in Itu local government area. The study concludes that the poor soil quality attributes, soil conservation and management practices contribute to gully development in the area, hence, the need for government to enact laws against such activities that favour gully growth and initialization.
    },
     year = {2024}
    }
    

    Copy | Download

  • TY  - JOUR
    T1  - Assessment of Morphometric Characteristics and Gully Development Susceptibility in Itu Local Government Area Using Geographic Information System
    
    AU  - Ehiremen Lucky
    AU  - Abraham Comfort
    AU  - Saturday Unyime
    Y1  - 2024/08/27
    PY  - 2024
    N1  - https://doi.org/10.11648/j.jenr.20241303.12
    DO  - 10.11648/j.jenr.20241303.12
    T2  - Journal of Energy and Natural Resources
    JF  - Journal of Energy and Natural Resources
    JO  - Journal of Energy and Natural Resources
    SP  - 125
    EP  - 137
    PB  - Science Publishing Group
    SN  - 2330-7404
    UR  - https://doi.org/10.11648/j.jenr.20241303.12
    AB  - The intensification in urbanization and wrong termination of drains into ravine has resulted in gully development which has rendered people homeless and reduced agricultural and economic development. Consequently, this study assessed morphometric characteristics and gully development susceptibility in Itu Local Government Area using Geographic Information System. In conducting this study, measurement of the morphometric parameters of the identified gullies were carried out while the susceptibility extent of gully development was done using multi-criteria technique in GIS. In assessing the characteristics features of the gullies, Field surveys measurements of gully morphology and hydraulic variables were carried out by the researcher using Global Positioning System (GPS), measuring tape, ranging pole, etc. This help in determining gullied land volume and cross-sectional area. Result of the study shows that the measured gully depth varies from 6.4m at Obong Itam to 25.8m at Enen Atai, while the gully width ranges from 4.1m in Ikot Ekang to 9.3m in Ntiat Itam. The cross-sectional profiles ranges from 45.43m2 to 165.12m2. Also, the cross-sectional profile of the area indicative of V-shape to U- shape, all with very narrow gully width and steeply sloping gully sides, which are features of gullies developed on very loose and incoherent soils that slump/collapse on exposure. On the other hand, the mean sand composition of the soil was 62.2% ranging between 55.3-70.1 while silt ranges from 17.7-25.2 with a mean of 20.2% and clay ranging between 10.0-21.9 with mean of 17.7%. The correlation matrix between the gully depth and cross- sectional area (0.84) and is significant at 99% confidence level, meaning that the retreat of gully sides take place at rates proportional to the rate of gully deepening. In assessing the susceptibility extent of gully development in Itu Local Government Area using multi-criteria Analysis technique, the summary of the map shows that 52.94% of the total study area are highly susceptible to gully development, 28.19% are moderately susceptible while 9.31% and 9.56% marginally and not susceptible respectively to gully development in Itu local government area. The study concludes that the poor soil quality attributes, soil conservation and management practices contribute to gully development in the area, hence, the need for government to enact laws against such activities that favour gully growth and initialization.
    
    VL  - 13
    IS  - 3
    ER  - 

    Copy | Download

Author Information
  • Department of Geography and Natural Resources Management, University of Uyo, Uyo, Nigeria

  • Department of Geography and Natural Resources Management, University of Uyo, Uyo, Nigeria

  • Department of Geography and Natural Resources Management, University of Uyo, Uyo, Nigeria

  • Abstract
  • Keywords
  • Document Sections

    1. 1. Introduction
    2. 2. Result
    3. 3. Discussion
    4. 4. Conclusion
    5. 5. Recommendation
    Show Full Outline
  • Abbreviations
  • Author Contributions
  • Conflicts of Interest
  • References
  • Cite This Article
  • Author Information